Seeing Things: Visualizations and History
Six weeks ago, an entrepreneurial/tech magazine, Fast Company, profiled the Spatial History Project over at Stanford in a piece on GIS-mapping (Geographic Information Systems) and the digital humanities (read our commentary on the article and the Stanford project here), and just last Tuesday, the web edition of the New York Times had a front page story--the latest in Patricia Cohen's "Humanities 2.0" series--that took a wider-angle approach to the same subject. It's safe to say the news is out on two fronts: digital mapping isn't just for planning your commute, and humanists are actually on the cutting edge of developing new uses for the technology.
When the Fast Company piece came out, I argued in this space that despite representing but one methodological branch of the digital humanities, the new spatial history projects can serve as a particularly good point of access for those curious about what the digital humanities bring to the scholarly table. Part of the appeal of a project like Stanford historian Richard White's visualization of western railroad history, I suggested then, "surely lies in the fact that White's subject (the development of the rail network) is fantastically well-suited to his chosen tools--digital mapping and GIS. Paired with a historical subject that we intuitively grasp as being spatially-oriented, White's methodology seems neither ostentatiously novel nor at all whimsical but entirely appropriate, even to the non-specialist."
Reading Cohen's article earlier this week, I had the sense that what I'd already written about White's project might hold for the GIS-based methodology as a whole. This is not to privilege spatial history among the various innovations of the new school humanists but to make an argument in isolation about an aspect of visualization that is inherent to much historical storytelling. While I had previously suggested that Richard White's project involved a subject that might be intuitively understood as having a particularly strong spatial orientation, it could be argued that a great deal of fine history-writing hinges on the author's ability to reconstruct a place--be it George Chauncey's New York or Antony Beevor's Stalingrad--as it was at a moment in time.
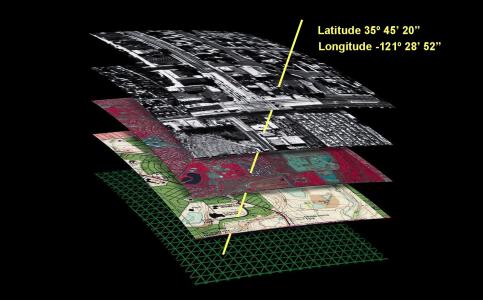
Chauncey's Gay New York and Beevor's Stalingrad are, respectively, a cultural history and a military one, but both works trade on a strong sense of place, a mapping of the action onto a historical urban environment. A feat of visualization is performed, then, as a collaboration between writer and reader; place is evoked by the descriptive power of the writing and the persuasive grain of the detail. And as easy as Beevor's prose makes it to imagine the burned out hell of the Soviet city-cum-war zone, it is equally easy to imagine how a story like that of Stalingrad could be richly augmented with a GIS project showing, for example, troop movements over historical maps of the ravaged city. Similarly, a project like Chauncey's could layer data about spots of subcultural significance over an urban map of old New York. Such maps could come from a variety of sources (I'm put in mind of the digital collection of the old Sanborn fire insurance maps that cover much of urban California ca. 1900), and more importantly, these maps can then be layered with a virtually endless variety of supplemental data sets, each of which has the potential to illuminate some hitherto unnoticed or underappreciated strand of a story.
GIS-empowered spatial history, then, represents a new wrinkle in the tradition of visualization in historical storytelling. The technology of digital mapping transposes some of the act of visualizing from the moment of the telling (the transmission of the story) to an earlier moment in the research process (the construction of the story). Consider an example from Cohen's article describing the digital rendering of the Gettysburg battlefield using a variety of sources to recreate the historical terrain. What researchers are constructing here is more than a new means for the end user or reader to more fully "experience" the story of Gettysburg: the new visualization will, it is hoped, change the story itself as historians are able to reinterpret events with previously unrealizable perspectives on the data now given visual and spatial form.
Almost paradoxically, the innovation of the new spatial histories manages to be both cutting edge and about as profoundly relatable and intuitive as a revolutionary methodology can be. It takes only a second to realize that the telling of a battlefield story could benefit from a familiarity with the topography of that battlefield. This makes sense to us--to specialist and layman alike, and I think the combination of an exciting but relatable methodological advance with a technology (digital mapping) that is at least basically familiar to many people in 2011 sets up the new spatial history to be a field with tremendous potential for groundbreaking research AND relatively broad-based appeal. The methodological swing of the "spatial turn" in the 21st century stands to be a good deal less alienating of the layman than was, say, the theoretical swing of the "linguistic turn" of the 20th.